The taxi service is an important transportation mode in urban areas. In this project, I will be analyzing City of Chicago taxi trip data. This dataset does not include the taxi trips data from ride-sharing companies such as Lyft, Uber, etc.
I have taken a sample of data from a huge dataset to see what all information I can get from it. Like, how centralized is Chicago? Do Chicago residents use taxis more during rush hours? Is the taxi fare usually higher during rush hour? Is taxi fare higher in the downtown area? What is the relationship between distance traveled, time taken and fare?<>
Hypothesis Generation:
- Chicago is centralized
- Chicago residents use taxis more during rush hour
- Taxi fare is higher during rush hour
- Taxi fare is higher for downtown Chicago residents than other parts of Chicago
- If the distance traveled is more, then the fare is higher.
- There is a strong relationship between distance traveled, time taken and fare.
Hypothesis: Chicago is centralized
The above plot shows most trips start out from the center of the city, around the airport area, and the University of Chicago. To understand this pattern better I have created a pie chart with ride counts from 20 most popular taxi pick up areas in Chicago.
As you can see, more than fifty percent of ridership is concentrated in the downtown area. Therefore, it can be said that the taxi trip analysis shows that like most other cities in the world, downtown Chicago is also centralized. There are always many more taxi pickups and drop offs in those community areas in the city center.
Hypothesis: Chicago residents use taxis more during rush hour
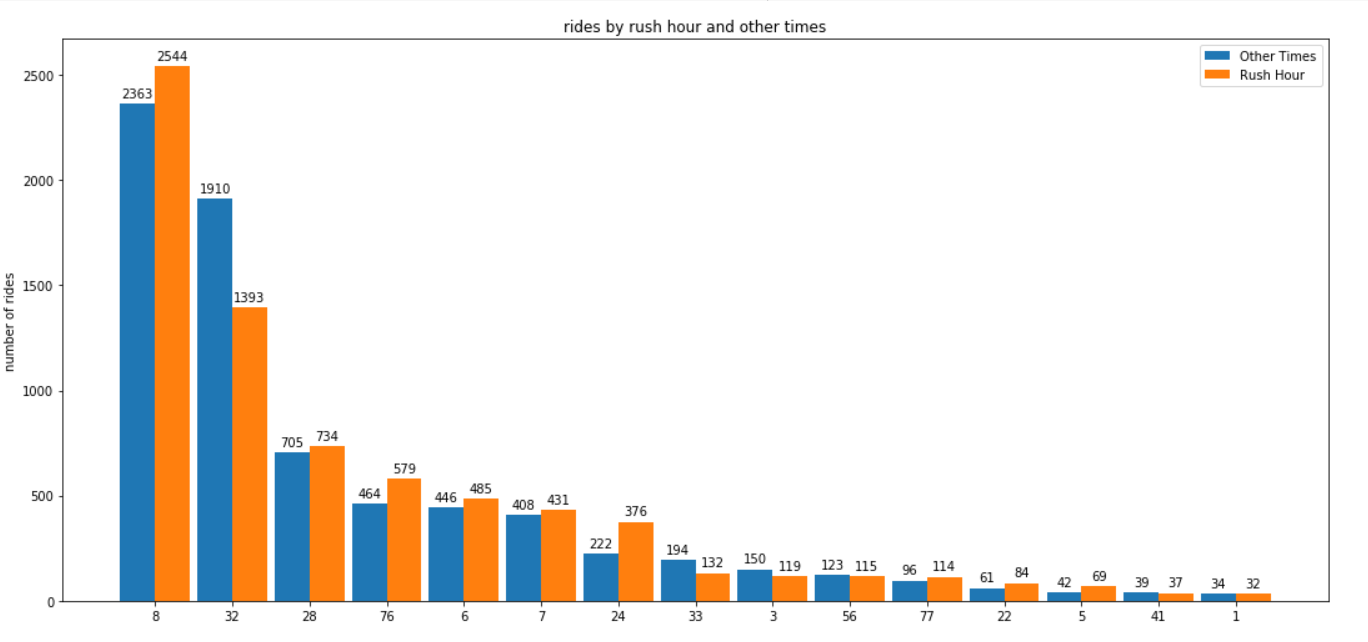
As the plot depicts only two areas in Chicago showed a significant difference otherwise the ride count is the same . On further investigation, it was seen that these two areas usually face huge traffic jams due to which most taxis avoid these routes during rush hour. Furthermore, when I conducted a T-test for means of the two independent samples with the null hypothesis that two independent samples have identical average (expected) values i.e there is no difference in ridership between rush hours and other times as expected the T test gave a p value is 0.99728. Therefore it can be said that ridership is equal during rush hour and other times.<>
.png)
Hypothesis : Taxi fare is higher during rush hour
Now let us explore whether the fare is higher during rush hours. After exploring the data it can be seen there is a difference in fare during rush hour and other times. But as the difference is only 3,826.73 dollars is this significant enough? So let us explore this further with a T-test for means with the null hypothesis that there is no difference in fare between rush hours and other times. The p value of 0.008651 confirmed that yes taxi fare is significantly higher during rush hours.<>
.png)
Hypothesis: Taxi fare in downtown Chicago is higher than other parts of Chicago
For this analysis I created two data sets, one of downtown Chicago and the other of other parts of the city. And by exploring this two datasets I found that the total fare amount is much higher in downtown area as the ridership is higher in downtown and the taxi fare i.e the cost of travel is also higher for downtown Chicago than other parts of Chicago.<>
Hypothesis: If the distance traveled is more, then the fare should be higher
The plot clearly shows that there are multiple linear correlations between trip distance and cost. But for the majority of trips, their cost depends on the distances<>. Most of the trips are small trips. In this case small trips are those which has a trip time of less than 15 minutes, trip distance of less than 2 miles and cost of less than 10 dollars.
Hypothesis : There is a strong relationship between distance traveled, time taken and fare.
To understand the relationship between distance traveled, time taken and cost let us visualize the data with the help of some pair plots.
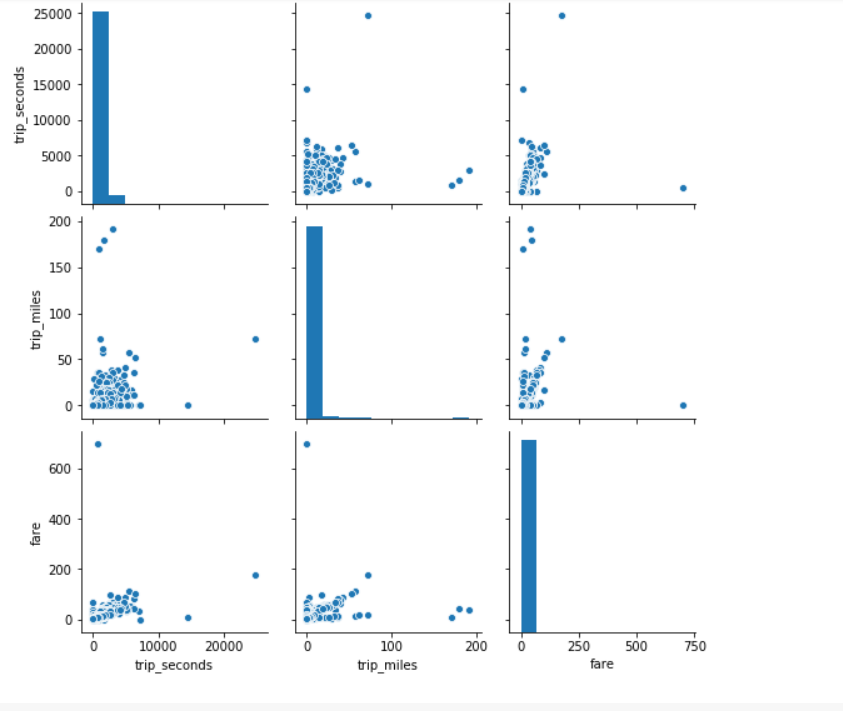
As you can see there is a drop in the distribution of both trip duration and distance when the corresponding values are very small, and there is a small bump in distance and cost when the corresponding values are relatively large.Trip duration does not seem to have a linear correlation with distance. We can see that short trips take a long time to complete, whereas some long distance trips take less time to finish.
To explore this further we will analyse the correlation matrix of these features.
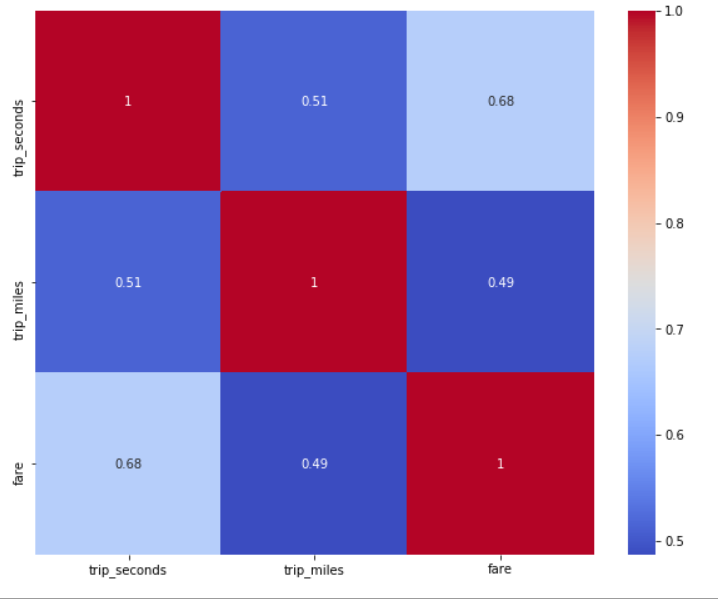
Analyzing the correlation matrix we can say that the mileage and duration of a trip tend to correlate with each other.The longer the trip, then longer time it takes to complete. The trip mileage correlates with trip duration. Trip fares have stronger correlations with trip distance and duration than those of total cost of trips. As many other random factors add to the total payment.The traffic condition is rather complicated in the city and it is hard to predict cost of the trip based on these factors only.
Summary
- From the taxi rides analysis we can say that Chicago is a centralized
- Chicago residents do not use taxis more during rush hour
- Taxi fare is higher during rush hour
- Taxi fare is higher for downtown than other parts of Chicago
- If the distance to be traveled is more, then the fare should be higher.
- There is a strong relationship between distance traveled, time taken and fare.